Operational overview
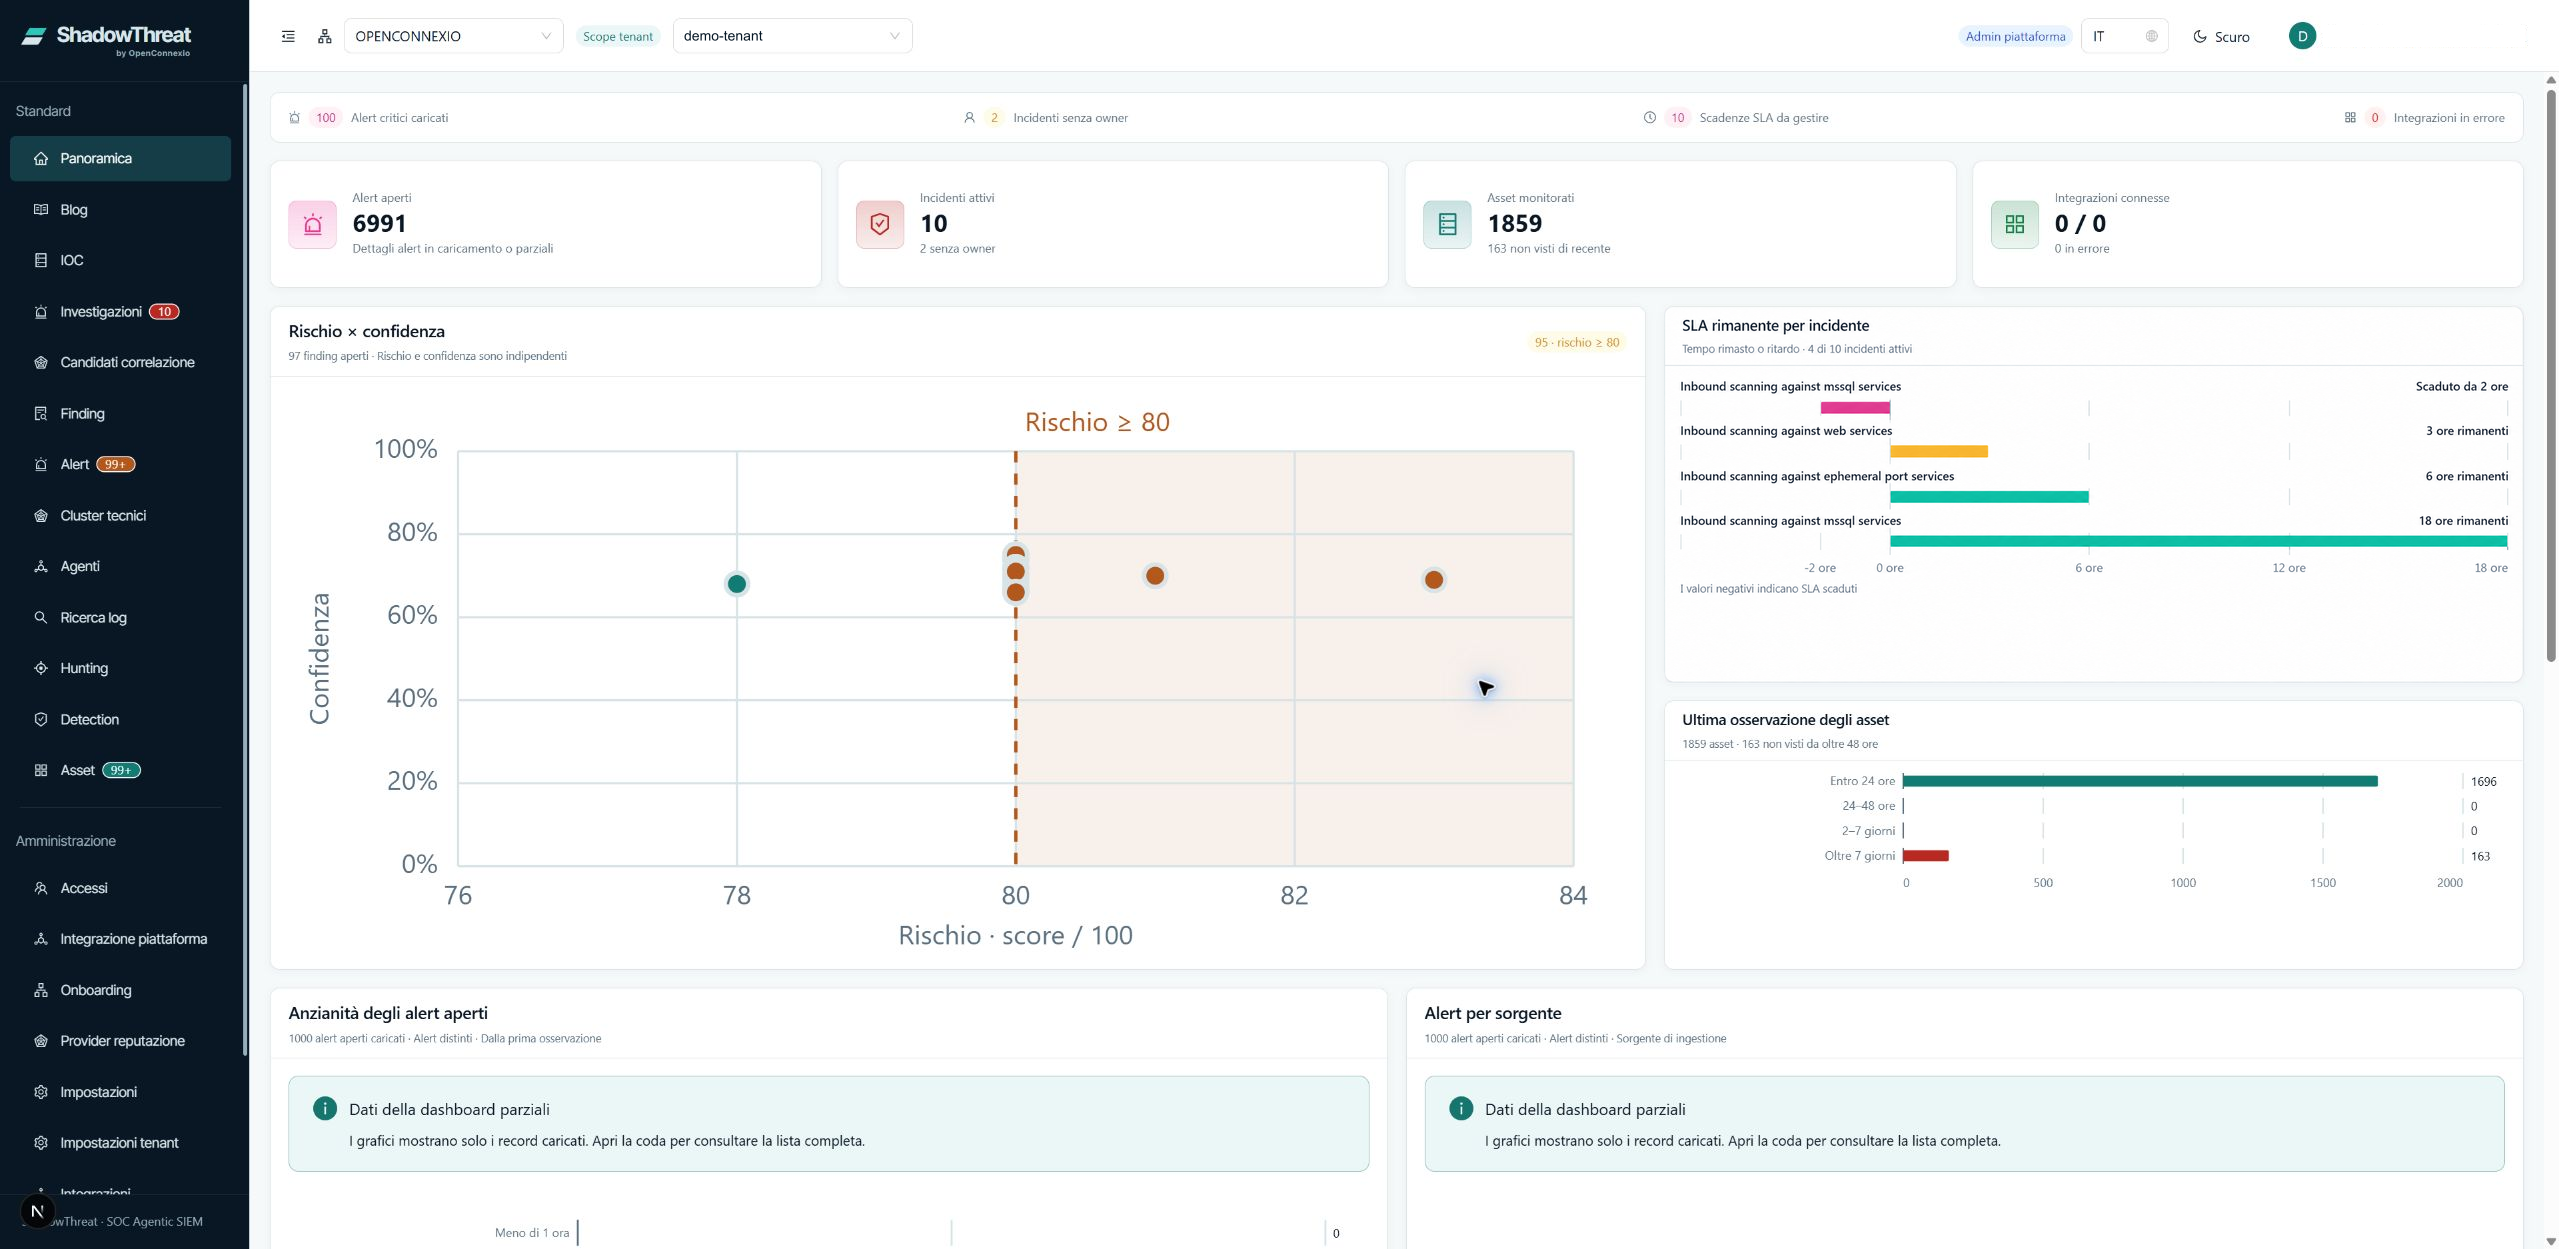
Open alerts, active incidents, monitored systems and integrations available for the selected customer or environment.
Platform
ShadowThreat brings together security alerts, affected systems, evidence and actions. For every case, it shows what happened, who needs to act and which organization or environment it belongs to.
Operational capabilities
Every screen clearly shows which customer or environment the data belongs to. Available views and features vary according to the user’s role and selected configuration.
Open alerts, active incidents, monitored systems and integrations available for the selected customer or environment.
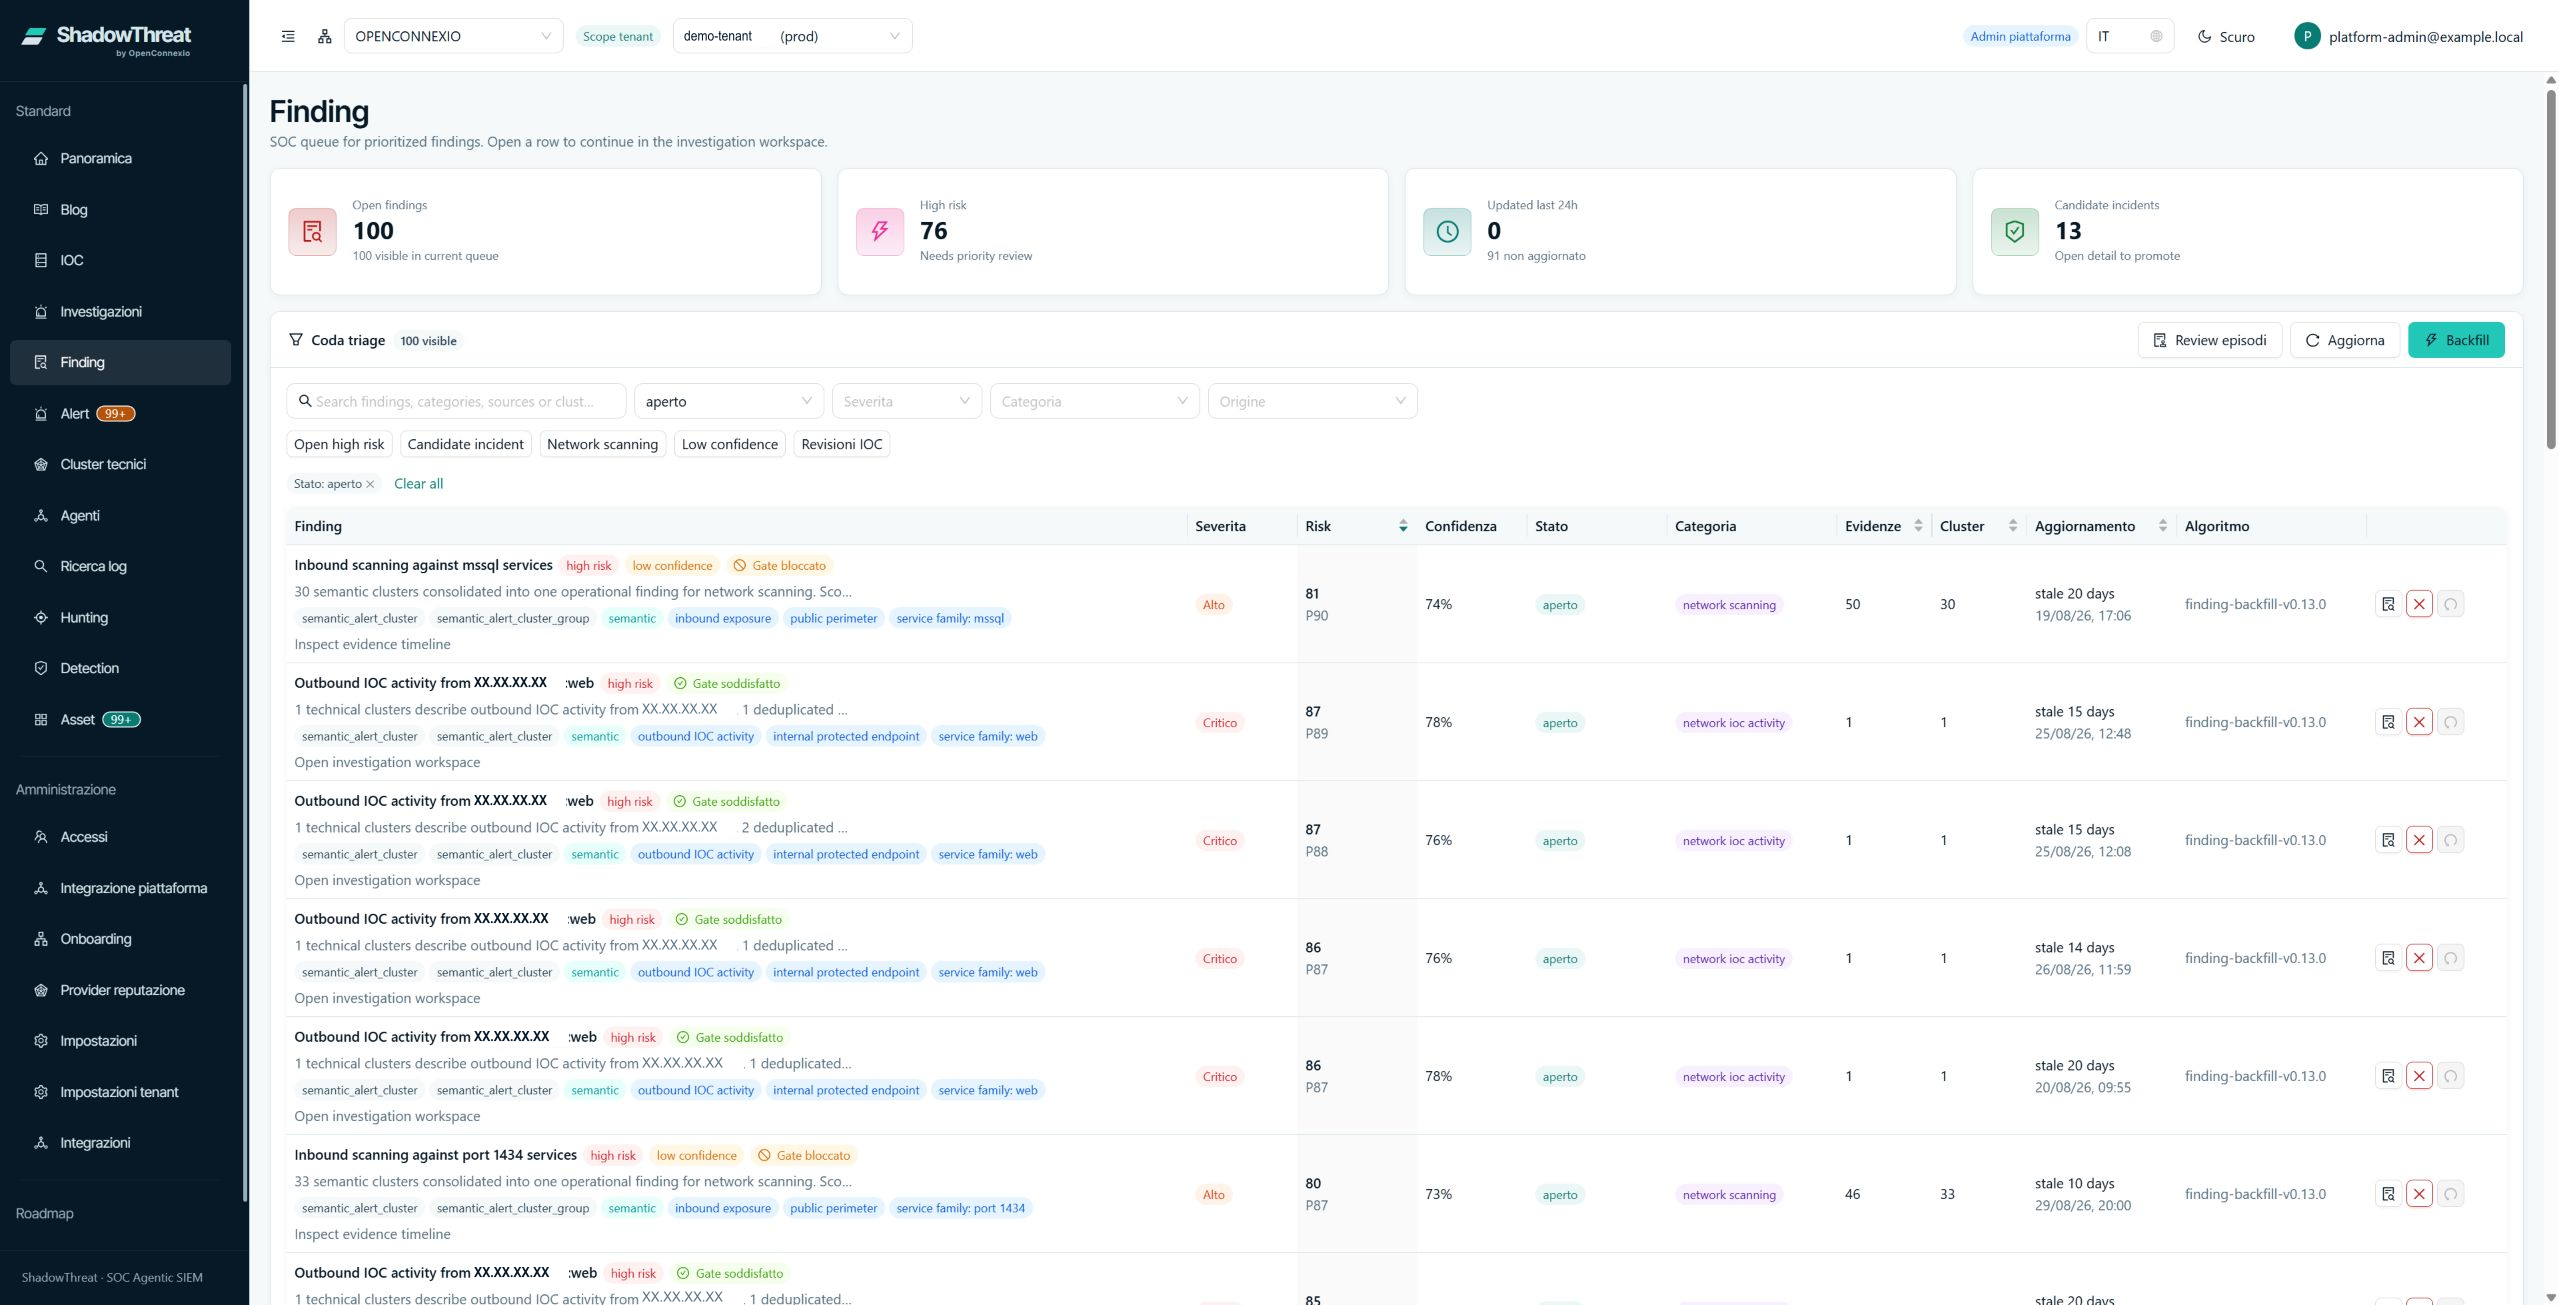
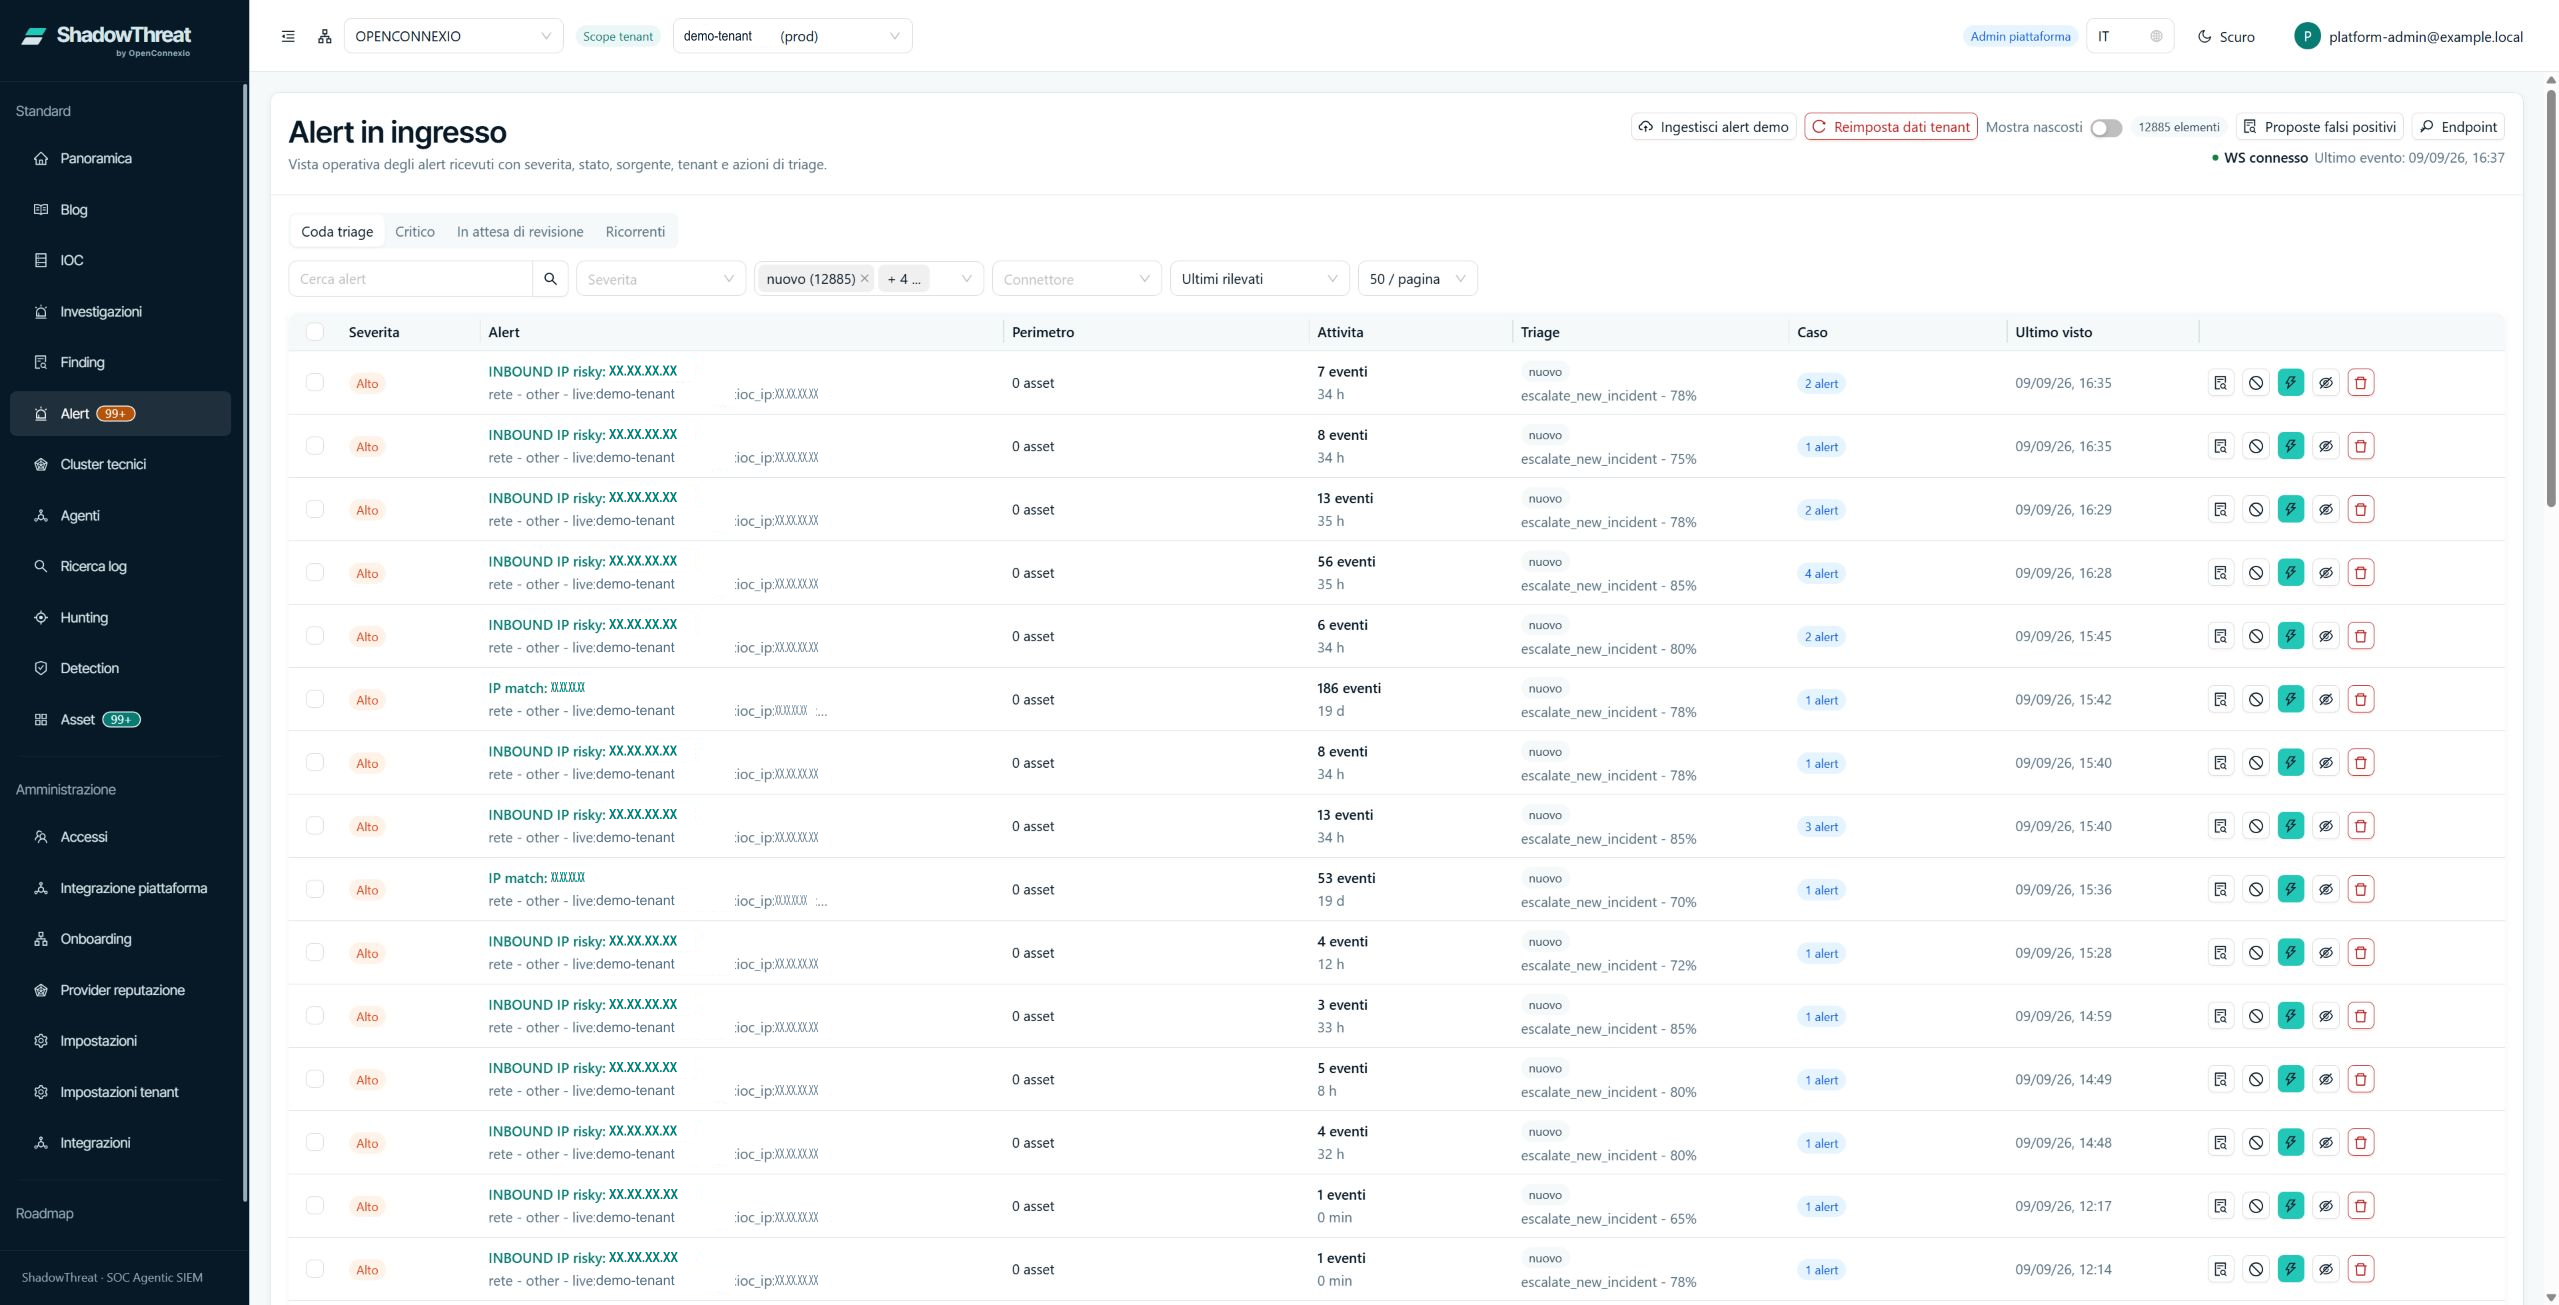
Search, priority, status and source help the team quickly identify alerts that require attention.
Findings—cases requiring further review—bring together evidence, affected systems, risk and the assessment’s confidence level.
A reviewed case can become an incident with evidence, owners and required actions kept together.
Inventory, vulnerabilities and system information. A tenant is the separate environment assigned to the selected customer or business unit.
Rules, thresholds and threat indicators are prepared, approved and released through a controlled process.
Indicators, sources and supporting information help analysts validate a signal and look for related suspicious activity.
Technical log searches remain limited to the selected customer or environment, preventing data from different organizations from being mixed.
Operational overview
The overview brings together the indicators that guide the team’s work. The operational scope—the selected customer, public body or environment—gives each figure meaning and leads the analyst to the relevant details.
How context is built
From the selected environment to the operational decision, each step adds information while keeping data and ownership clear.
The selected partner, customer and environment always show which data and systems the analyst is working with.
Source, priority, status and event sequence describe where the analysis begins.
Systems, vulnerabilities, threat indicators and evidence help explain what was observed.
The case, incident and assigned actions preserve every step from review to response.
From volume to priority
Search and filters help identify the most important signals. From each alert, the analyst can review details, the event sequence, affected systems and available actions while keeping the relevant customer or environment visible.
Detection and threat intelligence
Technical capabilities connect detection rules, indicators of compromise (IOCs), keywords and threat sources to the review process. Statuses and approvals make the path clear before release.
Sigma-format detection rules managed according to the environment’s configuration.
Threshold-based conditions for use cases supported within the scope.
Indicators of compromise and operational terms organized by status and context.
Control steps before availability in the intended environment.
Actual availability of rules, integrations and workflows depends on the selected environment’s configuration and release plan.
FAQ
Open the overview and check which environment is selected. You’ll see open alerts and ongoing incidents. To see what’s behind a count, go to the corresponding list and open the item you want to look at.
Start with the inventory for the server’s environment. On the asset, you can see the details available, such as its operating system, detected software and vulnerabilities reported by connected sources. If something you expected is missing, check what the source is sending.
Check the rule’s status in the environment where you want to use it. Preparing, approving and publishing a rule are separate steps. To see whether your team can use it, check that it has been published for that environment.
See ShadowThreat in your environment
We start with your organization, systems and team responsibilities, then walk through the path from alert to decision together.